Agilent Technologies Announces Industry's Most Comprehensive LTE Signal Analysis Solution for Designers of Components, Transceivers
The following product photos are available for use by the media, based on the Keysight Photography Use Policy.
|
|
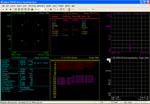
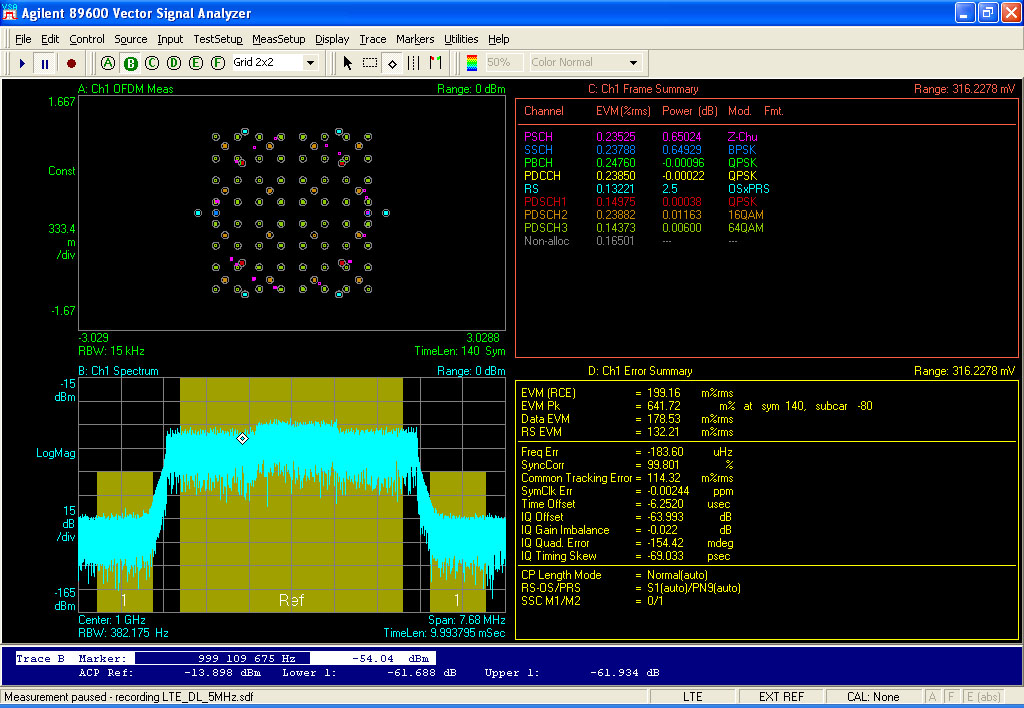
Image 1: Download JPEG (0.3MB) Download TIF (0.1MB) |
|
|
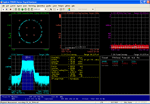
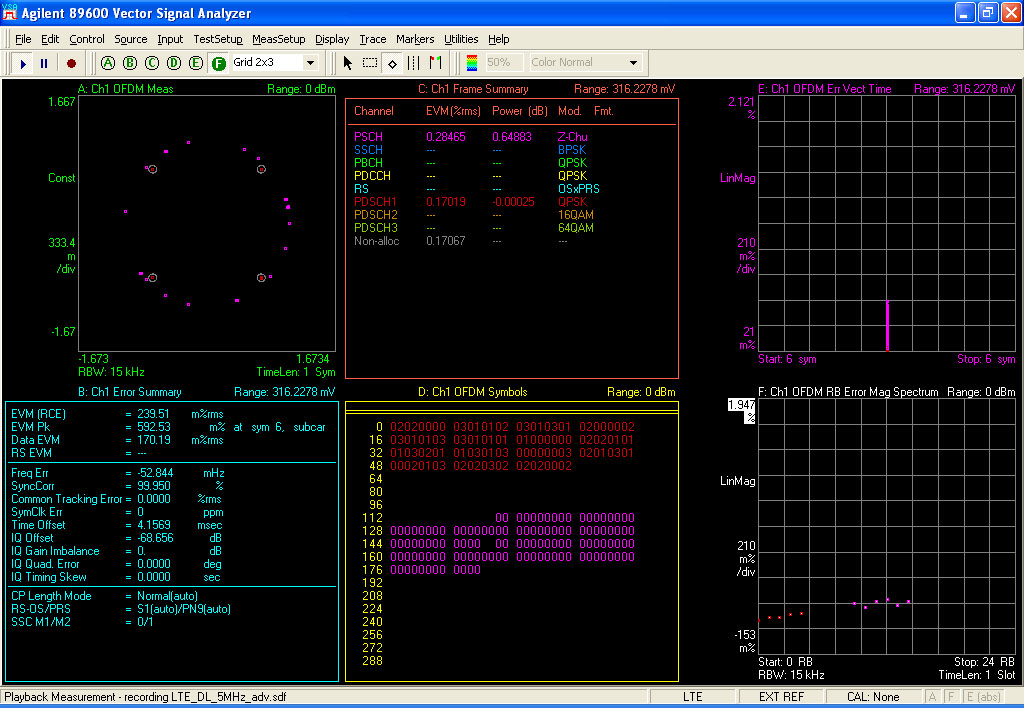
Image 2: Download JPEG (0.3MB) Download TIF (0.1MB) |
|
|
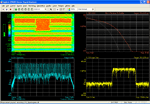
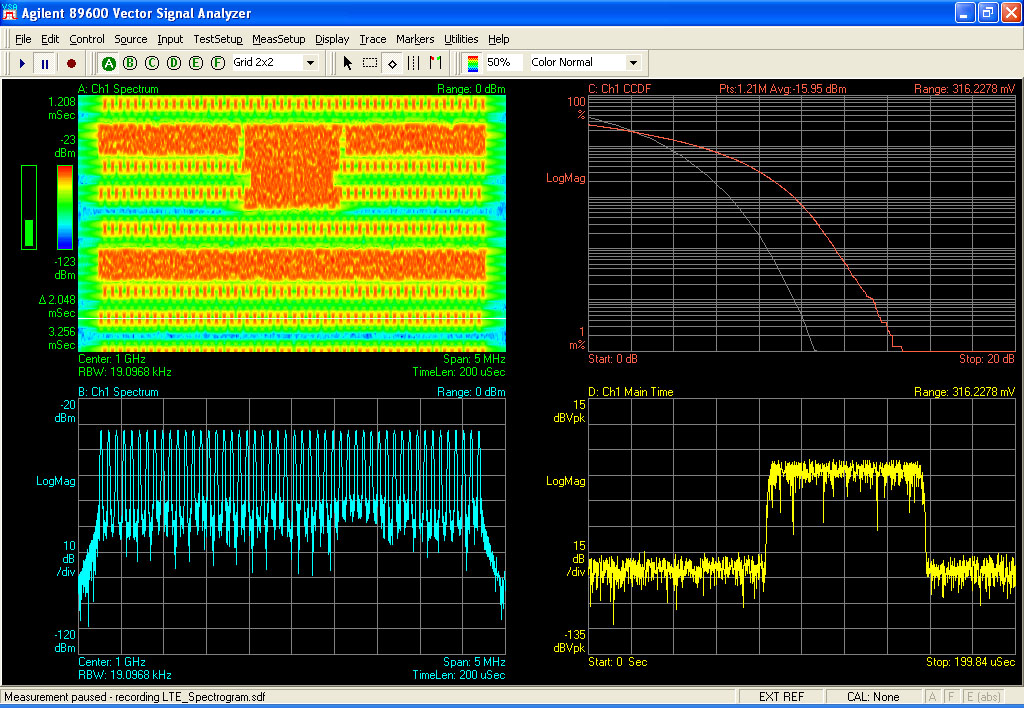
Image 3: Download JPEG (0.3MB) Download TIF (0.1MB) |
|
|
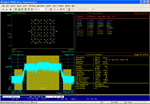
Image 4: Download JPEG (0.3MB) Download TIF (0.1MB) |
|
|
Image 5: Download JPEG (0.3MB) Download TIF (0.1MB) |
| Related Information | ||
| Press Release: |
Agilent Technologies Announces Industry's Most Comprehensive LTE Signal Analysis Solution for Designers of Components, Transceivers |
|
| Keysight Photography Use Policy: |
|
|
| How do I download images: |
|
|
|
|
||

 To
download files in Windows, use the right mouse button on the desired format
(JPEG or TIFF) and choose 'Save Target As...'
To
download files in Windows, use the right mouse button on the desired format
(JPEG or TIFF) and choose 'Save Target As...'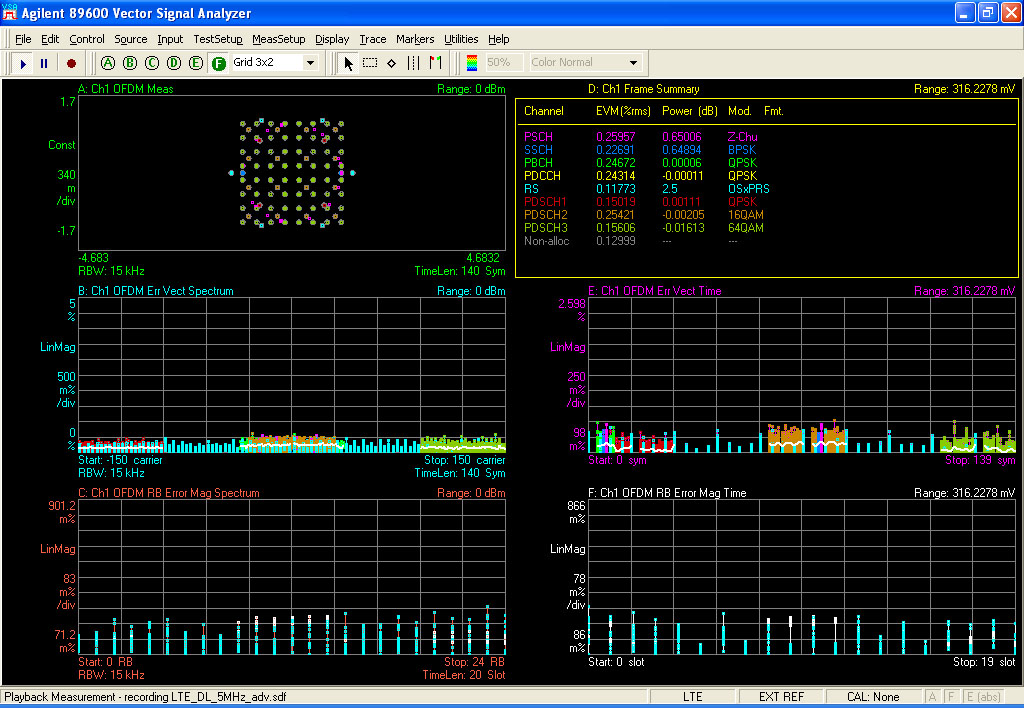